Case Study

ServiceNow CIO Dashboard

An automotive manufacturing organization in APAC creates a single view of its digital systems and maximizes IT investments.

A leading global manufacturer of trucks in the Asia Pacific optimizes IT investments and improves IT operations by gaining unified visibility into their IT performance through ServiceNow CIO Dashboard implementation.
Industry & Region: Manufacturing, APAC
Tech Stack: ServiceNow CIO Dashboard, ServiceNow Performance Analytics, ServiceNow Next Experience, ServiceNow ITSM, ServiceNow ITOM, ServiceNow HAM, ServiceNow SAM, ServiceNow SPM, ServiceNow SecOps
Client Overview
Our client is a well-known global manufacturer of heavy-duty trucks headquartered in the APAC (Asia Pacific) region, investing prudently in modern technologies to build safer and more advanced trucks and deliver exceptional customer experiences.
Business Problem
The client had been using various external tools and ServiceNow solutions, such as ITSM, ITOM, HAM, SAM, SPM, and SecOps, to streamline their workflows and carry out business operations.
While these solutions had been helping the automobile manufacturer achieve the desired outcomes, their leadership team strongly felt the need for a solution that would give them a bird’s eye view of the organization’s IT performance and facilitate decision-making across their IT value chain.
Considering KANINI as their trusted ServiceNow implementation partner owing to a series of successful ServiceNow implementations, the client had once again sought our technology expertise for an appropriate solution that can provide them with a comprehensive IT performance dashboard.
Solution Offered
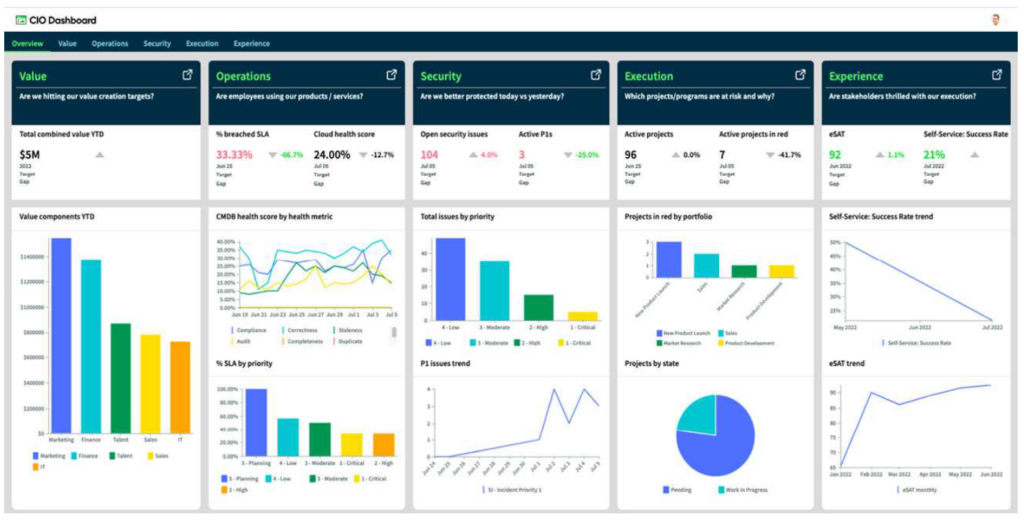
To meet the client’s requirements, we decided to implement the ServiceNow CIO Dashboard which would seamlessly gather and present insights from all of the organization’s ServiceNow applications on a single dashboard using ServiceNow Performance Analytics. Additionally, the dashboard’s “Next Experience UI” feature would deliver an intuitive and personalized user experience to achieve its productivity and customer engagement goals.
Our experts began the project by analyzing the client’s existing systems and the licenses for all of their ServiceNow applications. These licenses would enable the automobile manufacturer to easily access the relevant metrics on the portal and utilize the CIO dashboard effectively.
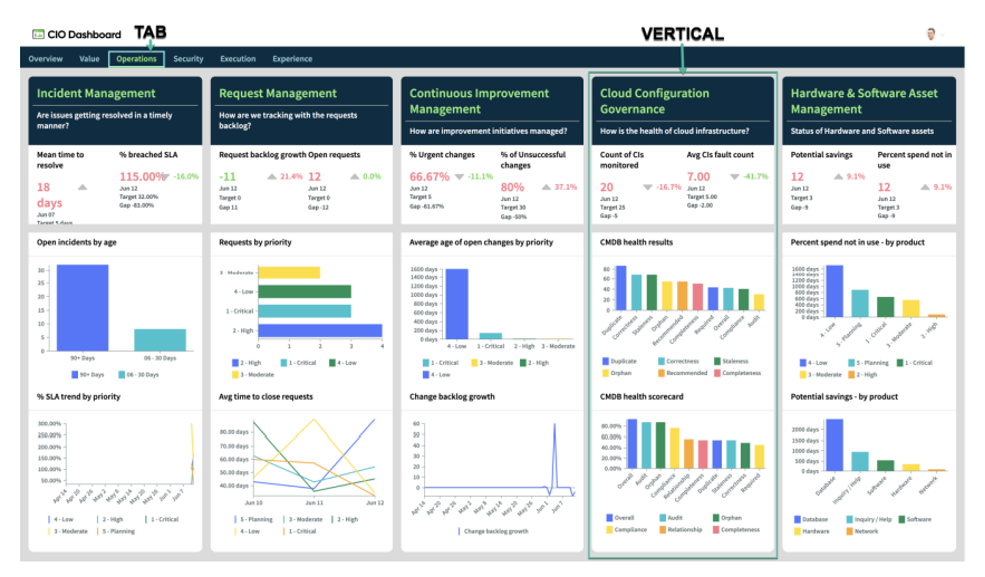
With these preliminary checks out of the way, we kickstarted the installation of the ServiceNow CIO dashboard and assigned relevant roles to users to enable them to view or configure the dashboard. Subsequently, we installed the Key Performance Indicators (KPIs) relevant to the client’s ServiceNow applications in the CIO dashboard. The successful installation of the KPIs enabled the company to visualize the metrics from each of its ServiceNow applications in vertical panels under relevant tabs on the dashboard.
Our experts then configured the names of the vertical panels and the metrics according to the company’s requirements.
With the appropriate execution of these processes, our client’s IT leadership team now has gained access to an all-in-one, interactive dashboard that efficiently gathered IT operations data across all of their ServiceNow applications and other tools and presented holistic insights.
Value Delivered
  • Empowered the IT leadership with actionable intelligence through analytics.
  • Provided a shared view of the IT performance to assess business value creation.
  • Improved user experience and optimized usage of IT systems.
  • Efficiently identified application security gaps and vulnerabilities.
  • Enabled informed decision-making about IT investments.
Want to optimize your digital value chain through ServiceNow implementation?
Connect with us.

ServiceNow CIO Dashboard