The Benefits of Microsoft Power BI – Bridging the Gap between Data and Decision-making

In this digital age, the ability to leverage vast amounts of data has become paramount to business success. To interpret and derive meaningful insights from such big data, Data Analytics and Data Visualization have emerged as essential processes, enabling organizations to make informed decisions and gain a competitive edge.

Data Analytics involves the analysis of the raw data by leveraging advanced algorithms and statistical techniques to extract meaningful insights. On the other hand, Data Visualization represents such insights through reports, dashboards, charts, and graphs which are easy to grasp. It transcends traditional spreadsheets and reports, transforming raw numbers into interactive and visually appealing graphics. It eliminates the reliance on abstract figures and allows for a deeper understanding of trends, patterns, and relationships. By presenting information in an imagery format, data visualization enables stakeholders at all levels to easily digest data and make better and more informed decisions.

The combination of business data analytics and visualization, commonly termed Business Intelligence, allows for a holistic approach to data-driven decision-making. To stay relevant and competitive in the market, it has become imperative for organizations to employ business intelligence tools that can assist them with data analytics and visualization. In this blog post, we will be exploring the features and benefits of Power BI, a cutting-edge business intelligence solution that empowers businesses to unlock the full potential of their data.

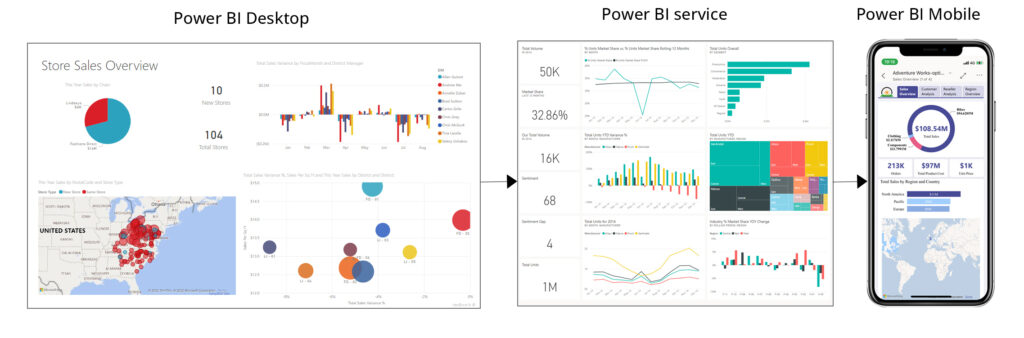
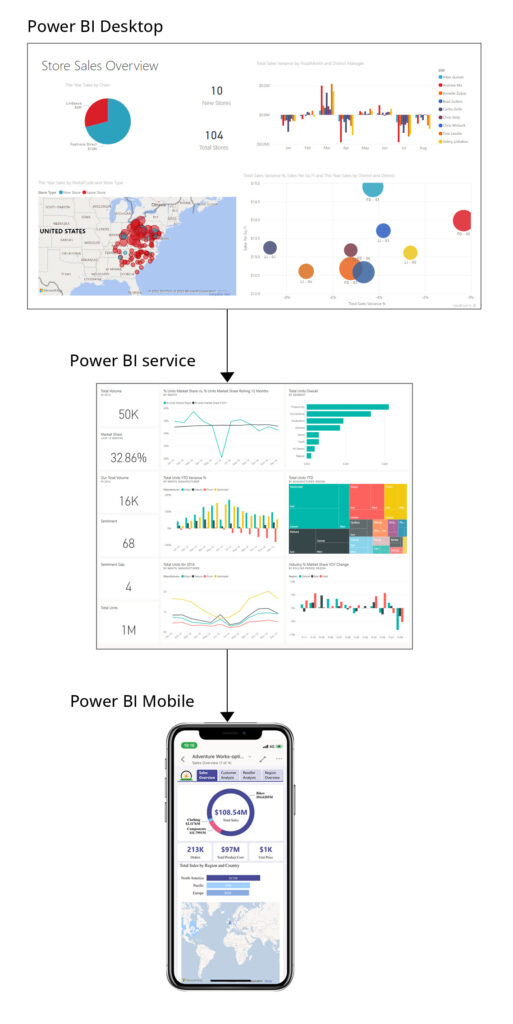
Microsoft Power BI – Elements, Features, and Benefits

Power BI is a collection of applications, connectors, and software services that turn raw and unorganized data into easily understandable and visually impressive insights. Be it an Excel spreadsheet or an on-premise data warehouse, Power BI enables businesses to connect to their data sources easily and then helps them visualize it to arrive at meaningful insights. These can then be turned into reports and shared with all the necessary stakeholders.
Power BI has many elements that work interdependently. The three main elements are:
  • Power BI Desktop (A desktop application)
  • Power BI Service (An online SaaS service)
  • Power BI Mobile App (Android/iOS app)
The usual workflow in Power BI is that data sources are connected to the Power BI Desktop app, where reports are built using raw data. The reports are then published in Power BI Service, from where they can be shared with anyone, and to the mobile app as well.

Features of Power BI

Microsoft Power BI stands out as a robust and versatile business intelligence with its comprehensive suite of features that enable organizations to transform raw data into actionable intelligence. Let’s delve into the key features that make Power BI a game-changer in the realm of data analytics:
1. Data Connectivity and Integration
Microsoft Power BI offers an extensive range of data connectors, allowing businesses to effortlessly connect to various data sources. From on-premises databases to cloud-based platforms, Power BI facilitates easy data integration. Furthermore, its tight integration with other Microsoft tools like Excel and Azure streamlines data flow across the entire ecosystem for businesses already using Microsoft.
2. Powerful Data Modelling and Transformation
With Power Query and Power Pivot, Power BI provides users with exceptional data modeling and transformation capabilities. Power Query is used for importing, cleaning, and shaping data, while Power Pivot is used for establishing relationships between queries and making meaningful tables from cleaned data. Such data shaping and cleansing functionalities enable businesses to achieve consistency and accuracy, ensuring reliable insights.
3. Interactive and Dynamic Data Visualization
Power BI offers a diverse array of visually stunning and interactive charts, graphs, and maps to bring data to life. It allows users to effortlessly create compelling visualizations, while the interactive dashboards and reports enable dynamic exploration of data. These captivating visualizations facilitate a deeper yet easier understanding of business metrics, trends, and patterns.
4. Collaborative and Sharing Features
Collaboration is key to driving organizational success, and Power BI excels in this area. With its workspaces and sharing options, teams can collaborate effectively on reports and dashboards, fostering a culture of data-driven decision-making. Integration with SharePoint and Teams further enhances the collaborative experience, ensuring seamless communication and knowledge sharing.
5. Advanced Analytics and AI capabilities

Power BI leverages advanced analytics and artificial intelligence to elevate business insights. Quick Insights and Q&A features enable users to gain instant, data-driven answers to their questions. Integration with Azure Machine Learning and AI services allows organizations to deploy predictive analytics models and forecast future trends with ease, enabling proactive decision-making.

Benefits of Using Power BI

Microsoft Power BI’s plethora of features brings a multitude of benefits that can transform how organizations approach data-driven insights. Let’s explore some of the key advantages that come with harnessing the capabilities of Power BI:
1. User-friendly and Intuitive Interface
Even without extensive coding knowledge, Power BI’s interface enables users to create visually appealing reports and dashboards effortlessly. Not only does this make data visualization accessible to more users in the organization but it goes a long way in strengthening the organizational business-storytelling capabilities significantly.
2. Scalability and Flexibility
Power BI’s architecture is designed to handle large datasets and complex analytics scenarios. Whether it is processing vast amounts of data or accommodating growing user demands, Power BI scales seamlessly. The benefit of using Power BI for organizations is that they get to leverage its cloud capabilities, ensuring flexibility in their analytics architecture.
3. Customization and Extensibility
No two businesses are exactly alike, and Power BI recognizes that. It offers a range of customization options, from custom visuals and themes to creating tailor-made calculations and measures using DAX (Data Analysis Expressions). This flexibility ensures that the analytics solution aligns perfectly with the specific needs of each organization.
4. Integration with the Microsoft Ecosystem
Being part of the Microsoft family is one of the most helpful benefits of using Power BI as it seamlessly integrates with other tools like Office 365 and Azure Services. This integration not only provides a familiar environment for users but also enhances data flow, collaboration, and productivity across the entire Microsoft ecosystem.
5. Security and Governance
Power BI places a strong emphasis on data security and governance. Robust security measures protect sensitive data, ensuring compliance with industry regulations. Granular access controls in Power BI allow organizations to manage data access effectively, ensuring that the right level of information is available for the right users.

Power BI – The Gamechanger

According to Gartner, Power BI has a massive market reach and momentum through Microsoft 365, Azure, Teams integration, flexible pricing, well-above-average functionality, and an ambitious product roadmap. Power BI also provides excellent cross-utilization within Microsoft’s Power Portfolio, with tools like Power Apps and Power Automate, to drive business value.
Power BI is a game-changing solution that empowers organizations to unleash the full potential of their data. With its extensive features and capabilities, Power BI equips businesses with the tools they need to drive innovation, make informed decisions, and achieve success in a data-centric world. Embracing Power BI means embracing a new era of business intelligence, where data becomes a strategic asset that propels organizations toward a prosperous future.
We at KANINI specialize in driving successful digital transformations for our clients. Our experts are well-versed in understanding varied business needs and creating tailored solutions to make data tell stories. Unlock the true potential of your data with Power BI and let KANINI be your trusted partner in this transformative journey. Contact us today and let’s work together to take your business story to the world.
Author

Balakrishnan Kaliyamurthy
Balakrishnan is working as a Data & BI Architect at KANINI. With 15+ years of experience in the IT industry, Bala contributed to the success of diverse projects across domains such as audit, BFSI, healthcare, supply chain, automobile, and IT infrastructure. His proficiency spans big data, Azure/AWS data services, and an array of BI tools including PowerBI, Tableau, Apache Superset, Qlik, AWS QuickSight, Spotfire, Trifacta, and MicroStrategy. Bala is passionate about crafting data solutions that drive results and empower businesses.
Social Share
Related Articles