Here is all you need to know about starting your journey of smarter decision-making and efficient planning with the power of BI tools for data visualization.
Turning Data into Actionable Insights with the Right BI Tools
- Descriptive Analytics that allows verification of what happened in the business.
- Diagnostic Analytics that identifies why it happened.
- The combination of the two – which would serve as input to Predictive and Prescriptive Analytics to understand the developing trends for the future and take appropriate actions.
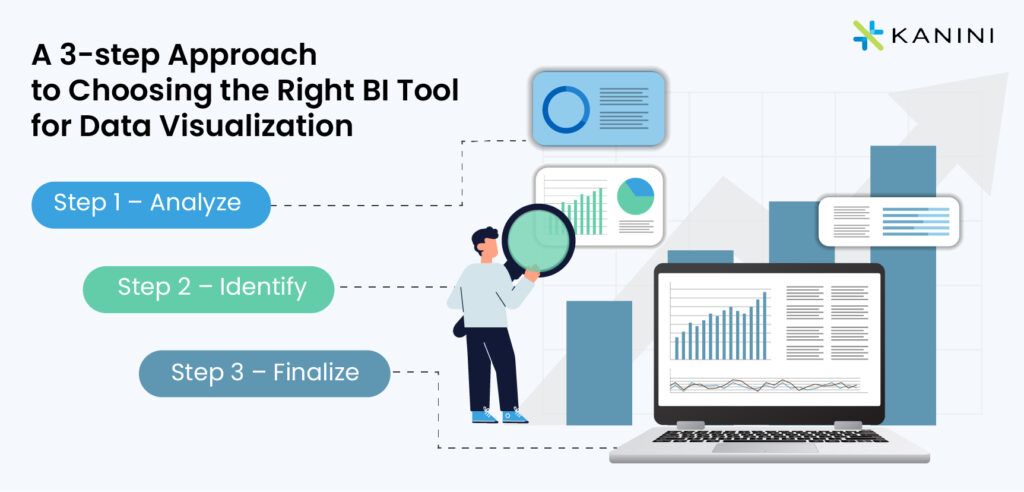
How to Choose a BI Tool for Your Business?
- How will a BI tool ingest and integrate data from various source systems?
- How will a BI tool help the user to model data using a low-code platform?
- Is the BI tool capable of handling high-velocity data to show real-time analytics?
- Is the tool capable of handling Complex Data Transformation processes via ETL?
- Is the tool enabling a downstream AI process?

A Detailed Comparison of a Few Powerful BI Tools for Data Visualization - Apache Superset, Power BI, Qlik, and Tableau
| Parameter | ||||
|---|---|---|---|---|
| OVERVIEW | Superset is a modern, open-source data exploration and data visualization platform that makes it easy for users of all skill sets to explore and visualize their data at the speed of thought, from simple line charts to highly detailed geospatial charts. | Microsoft describes its cloud-based intuitive tool Power BI as “a collection of software services, apps, and connectors that work together to turn your unrelated sources of data into coherent, visually immersive, and interactive insights.” There are different versions of Power BI offering different features. | QlikView, Qlik Sense, and Qlik AutoML come under the Qlik umbrella and offer self-serviceable, cloud-native data analytics platforms powered by AI. QlikView, a classic analytics solution, lets you build & deploy interactive dashboards. Qlik Sense is a more recent modernized version of QlikView. While Qlik AutoML helps to generate ML models for predictive analytics. | Tableau is a powerful data visualization tool that offers both self and cloud-hosted opportunities to generate interactive BI reports and dashboards even without any technical skill or programming knowledge. |
| ENTERPRISE SIZE | A great option for a business of any size looking for a low-cost/no-cost BI solution. It is used by large companies such as Airbnb, Lyft, and Netflix, as well as smaller ones. | Works well for small and medium-sized enterprises. | Suitable for enterprises of all sizes, from small businesses to large enterprises. | Medium and large enterprises with a dedicated BI team can use Tableau to its full potential. |
| PRICING | Open source/ Free BI visualization tool. | Costs around $10 per user per month. | Costs approx. $30 per user per month. | Costs approx. $70 per user per month. |
| LICENSING | Superset does not have a paid licensing option. | Power BI Desktop does not need a license. Power BI Pro is licensed per individual user. Power BI Premium is a capacity-based offering. |
Qlik requires a user-based license. It can be either a Professional and Analyzer User License or a Client Access License (CAL). | Offers subscription licenses that are either role-based or core-based subscriptions. |
| INSTALLATION & OPERATION | Requires SQL knowledge and expertise to install and run. | Easy to install and use - no knowledge of SQL is necessary to install and run. | Easy to install and use - no knowledge of SQL is necessary to install and run. | Easy to install and use - no knowledge of SQL is necessary to install and run. |
| STORAGE CAPACITY | Superset can store a massive amount of data at the database level. | The free version offers up to 1 GB of storage and in the Pro version, the storage limit can be extended to 10 GB. Above that requires cloud storage. | Qlik Sense has no free storage. Its cloud version however provides 500 GB of storage. | Offers a storage limit of around 100 GB. |
| SCALABILITY | Designed to be highly scalable and highly available for a large, distributed environment. Uses Druid services that can independently fail and restart without impacting other services. |
Power BI Premium Gen2 offers greater scale (Autoscale) by automatically adding compute capacity to handle heavy usage. | Qlik Sense Enterprise Scalability Tools help to test performance and plan scalability accordingly. Scalability Result Analyzer is used to analyze the performance and load. |
Highly scalable and capable of handling large data sets. Scaling Tableau Server is easy. |
| USER-FRIENDLINESS | Superset offers low-code/no-code visualization. | Too many features and icons. Overall, a user-friendly tool. | Simple interface that does not require much coding expertise | Tableau also has a very simple and user-friendly interface. |
| DASHBOARD | Offers 60+ vibrant charts - line, bar, area, scatter, pie, and more. Some of them are also customizable. | Around 30 types of charts, including 480+ third-party visuals, of which few are paid, are available for building the dashboard. | Offers 21 types of charts and 600+ third-party visuals to create data stories. Also provides intelligent and in-context commentary for the data analytics visuals. | Around 20+ charts are available on Tableau to create interactive dashboards with real-time visualizations. |
| MOBILE DEVICE COMPATIBILITY | Superset is designed to be responsive and can be used to create mobile-ready dashboards. | Supports mobile devices with good features and capabilities. | Issues regarding responsiveness and other impairments in iOS have been reported. | Supports customization for mobile devices. |
| AI | Although it has no inbuilt AI features, React JS can be used to create advanced AI features such as Natural Language Processing for text analysis, Machine Learning for predictive analytics and classification, and Computer Vision for image recognition and tagging. | PowerBI Premium Gen 2 offers advanced AI that bundles various cognitive services like Language Detection, Key Phrase Extraction, Score Sentiment, Tag Images, AutoML for Binary Prediction, Classification and Regression, and Model Explainability and Report. | Qlik’s Insight Advisor generates advanced analyses and insights; AutoML generates models, predicts using simple code-free experience, and offers a native connector for Amazon Sagemaker, Azure AutoML, DataRobot, and custom solutions built in R and Python. | Tableau supports augmented analytics with AI features like automatic data identification, smart data preparation, natural language interactions, and forecasting. |
| CLOUD COMPATIBILITY | Superset requires drivers for BigQuery and additionally an SQLAlchemy URI to connect to Google BigQuery. | Power BI Web Service supports direct connection to Google BigQuery and Google Analytics accounts. | Qlik offers connectors for various GCP services including BigQuery, Google Analytics, and CloudSQL. etc. | Tableau also supports direct connections to cloud-hosted data sources like Amazon Redshift, Amazon Aurora, and Google BigQuery. |
| SECURITY |
● User management, permission, and roles are handled by FAB (Flask App Builder) authentication. ● Permission to edit/view, access database, row-level security, and security vulnerability report. |
● Azure Private Link, Service Tags, and Azure Virtual Network to eliminate data exposure to the public internet. ● BYOK (Bring Your Own Key), IL6, FedRamp, HIPAA, and FINRA compliant. ● Network isolation. ● Secured end-to-end with double encryption. |
● TLS uses digital certificates to encrypt information exchanged between services, servers, and clients. ● Requires server certificate and client certificate. ● Rigorous testing process during development. ● Row and column-level data reduction through section access. |
● SSL/TLS encrypts and protects the communication between the Tableau Desktop and Tableau Server and secures the data from the Tableau server to databases. ● Tableau Cloud meets SOX, ISAE, and SOC industry compliance standards. |
| SUPPORT |
● Superset is supported by the Apache Software Foundation. ● Its strong community of ~ 6.5K members provides all the required support and updates on the software. ● Apache Superset is in its growth phase now and has great potential. Early adopters should definitely have an advantage. |
● Power BI comes with vast community support of ~13k online members. ● Users get support from the dedicated Microsoft team and the Central Hub across the world. ● Besides, there is direct access to the Power BI engineering team. |
● Offers great community support to users through the ~10k online members. ● Additional support through other channels like on-demand webinars, knowledge base, etc. |
● Users can get answers to their questions from the Tableau Community Forums. ● They can collaborate with other Tableau users and use the tool to work to their business advantage. |
Your Search Ends Here
Author

Anand Subramaniam
Anand Subramaniam is the Chief Solutions Officer, leading Data Analytics & AI service line at KANINI. He is passionate about data science and has championed data analytics practice across start-ups to enterprises in various verticals. As a thought leader, start-up mentor, and data architect, Anand brings over two decades of techno-functional leadership in envisaging, planning, and building high-performance, state-of-the-art technology teams.


